
Overview
The cause-and-effect diagram is a method for identifying problems and discovering improvements by diagramming the causal relationships of problems. 'Characteristics' refers to results, and 'factors' refers to causes.
Steps
- 1
Set the design goal in advance.

- 2
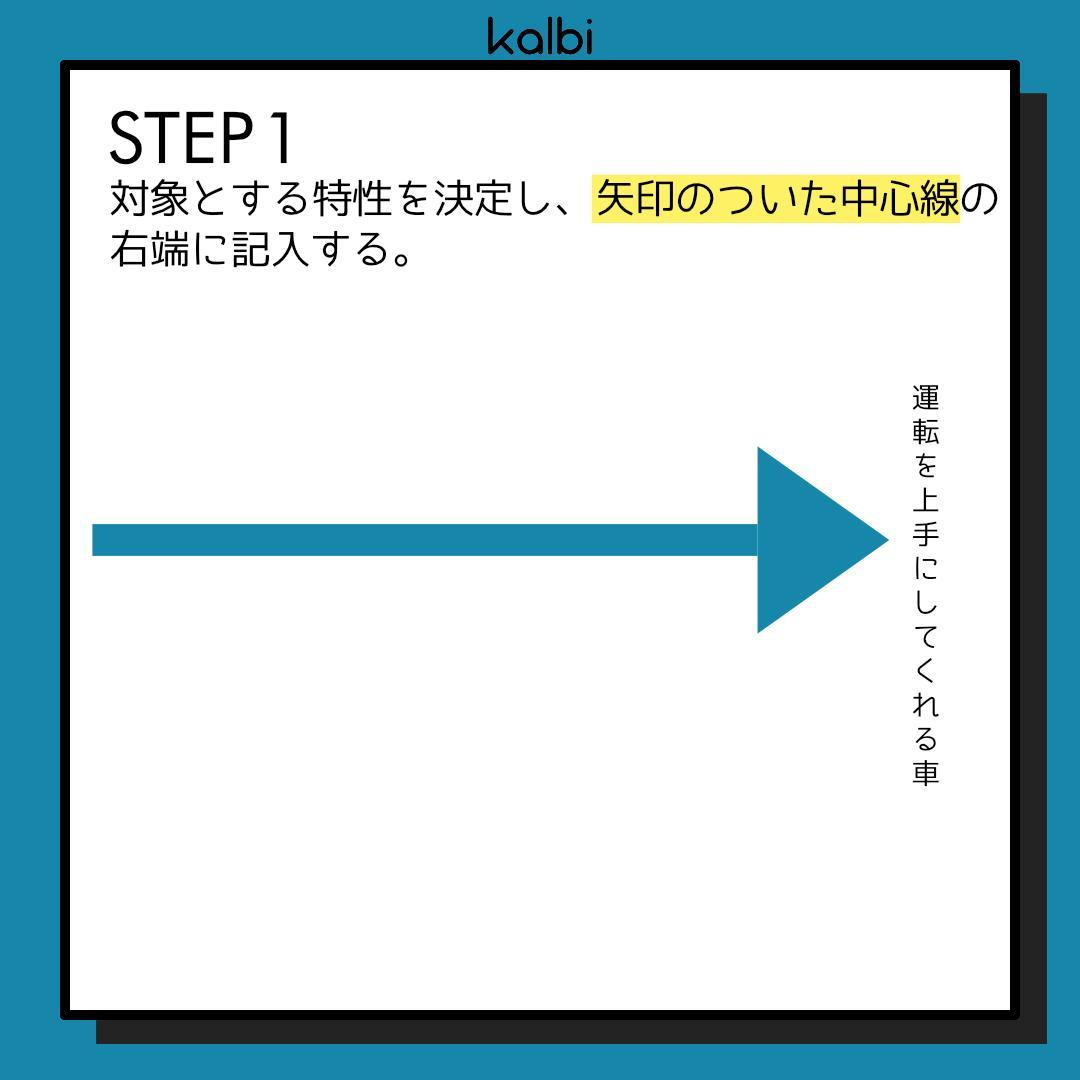
Determine the target characteristic and write it at the right end of the central line with an arrow.
- 3
Use literature research and ideation methods to extract related design elements. Then organize them by collecting similar content and classifying.

- 4
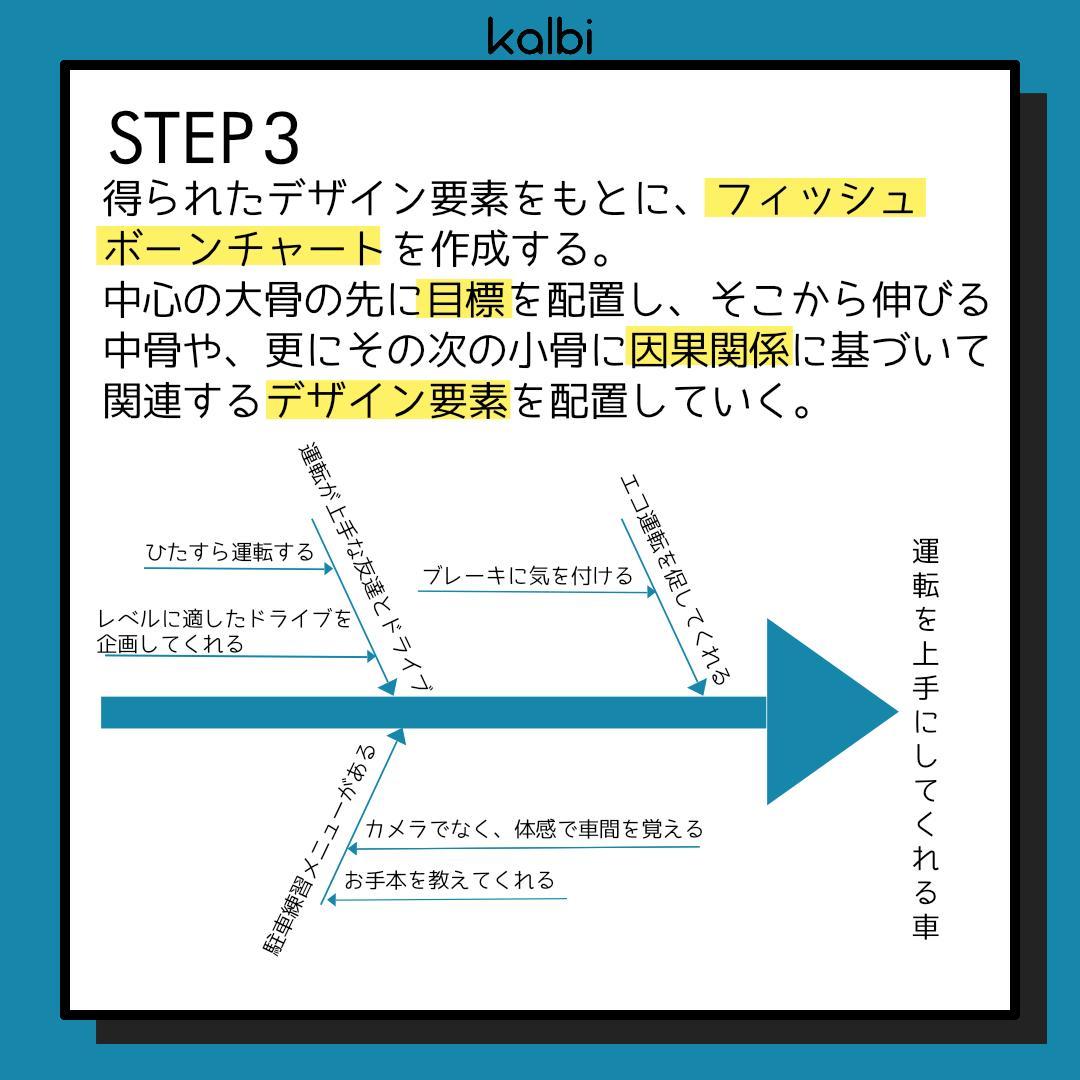
Based on the obtained design elements, create a fishbone chart. Set the main bone as the quality characteristic. Then arrange related design elements on the middle and smaller bones based on causal relationships.
Tips & Tricks
Recording the title, creator name, date, etc. on the created diagram is useful for review and reconsideration.
